
Documentation Index
Fetch the complete documentation index at: https://docs.xagent.run/llms.txt
Use this file to discover all available pages before exploring further.
Task Execution
Learn how Xagent plans, executes, and manages your tasks from start to finish.Execution Phases
1. Planning Phase
When you submit a task, Xagent first analyzes your request and creates an execution plan. What happens:- Xagent understands your goal
- Breaks down the task into steps
- Identifies required tools
- Generates a DAG (Directed Acyclic Graph)
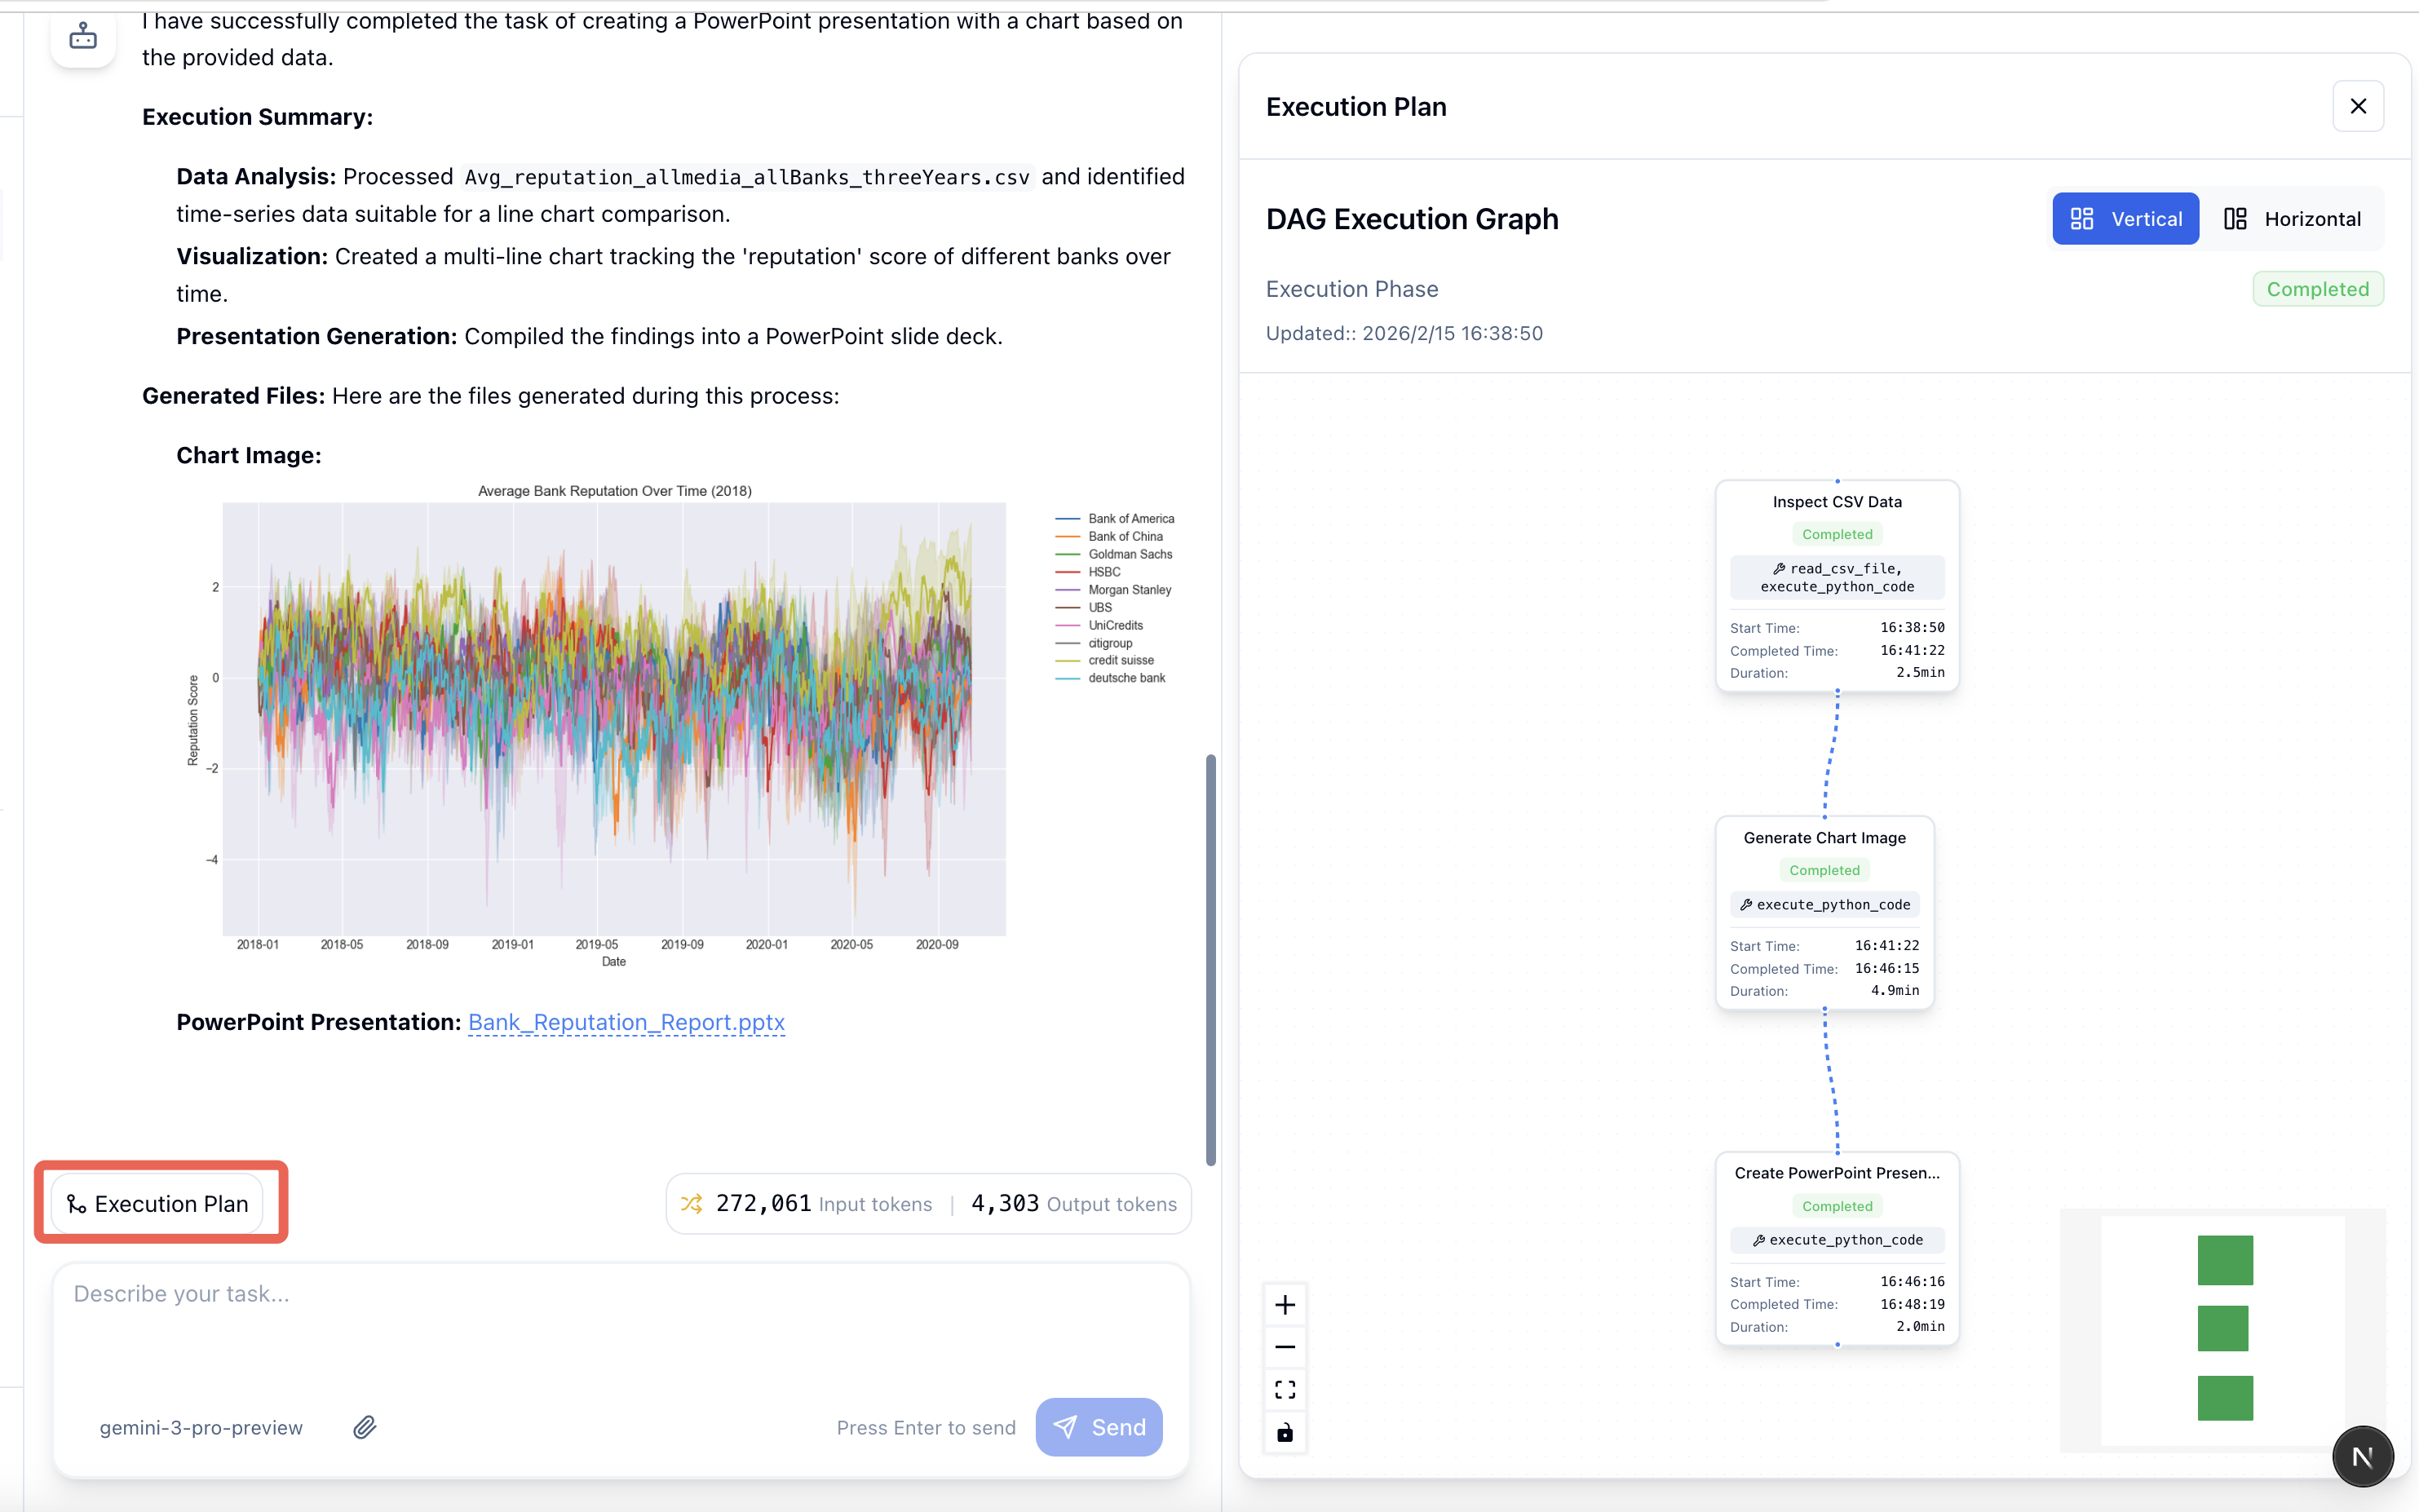
- Nodes (circles/boxes) - Individual execution steps
- Edges (arrows) - Dependencies between steps
- Flow - Execution order from start to finish
2. Execution Phase
Once the plan is ready, Xagent begins executing each step. What happens:- Steps execute in dependency order
- Tools are called automatically
- Results are passed between steps
- Progress updates in real-time
- Real-time progress tracking
- Step-by-step logging
- Error handling and retry
- Dynamic adaptation
3. Completion Phase
After all steps complete, Xagent compiles the final result. What happens:- Results from all steps are aggregated
- Final output is generated
- Execution summary is displayed
- Task is saved for reference
The Execution Interface
When your task runs, you’ll see the Agent Interface with a vertical step layout: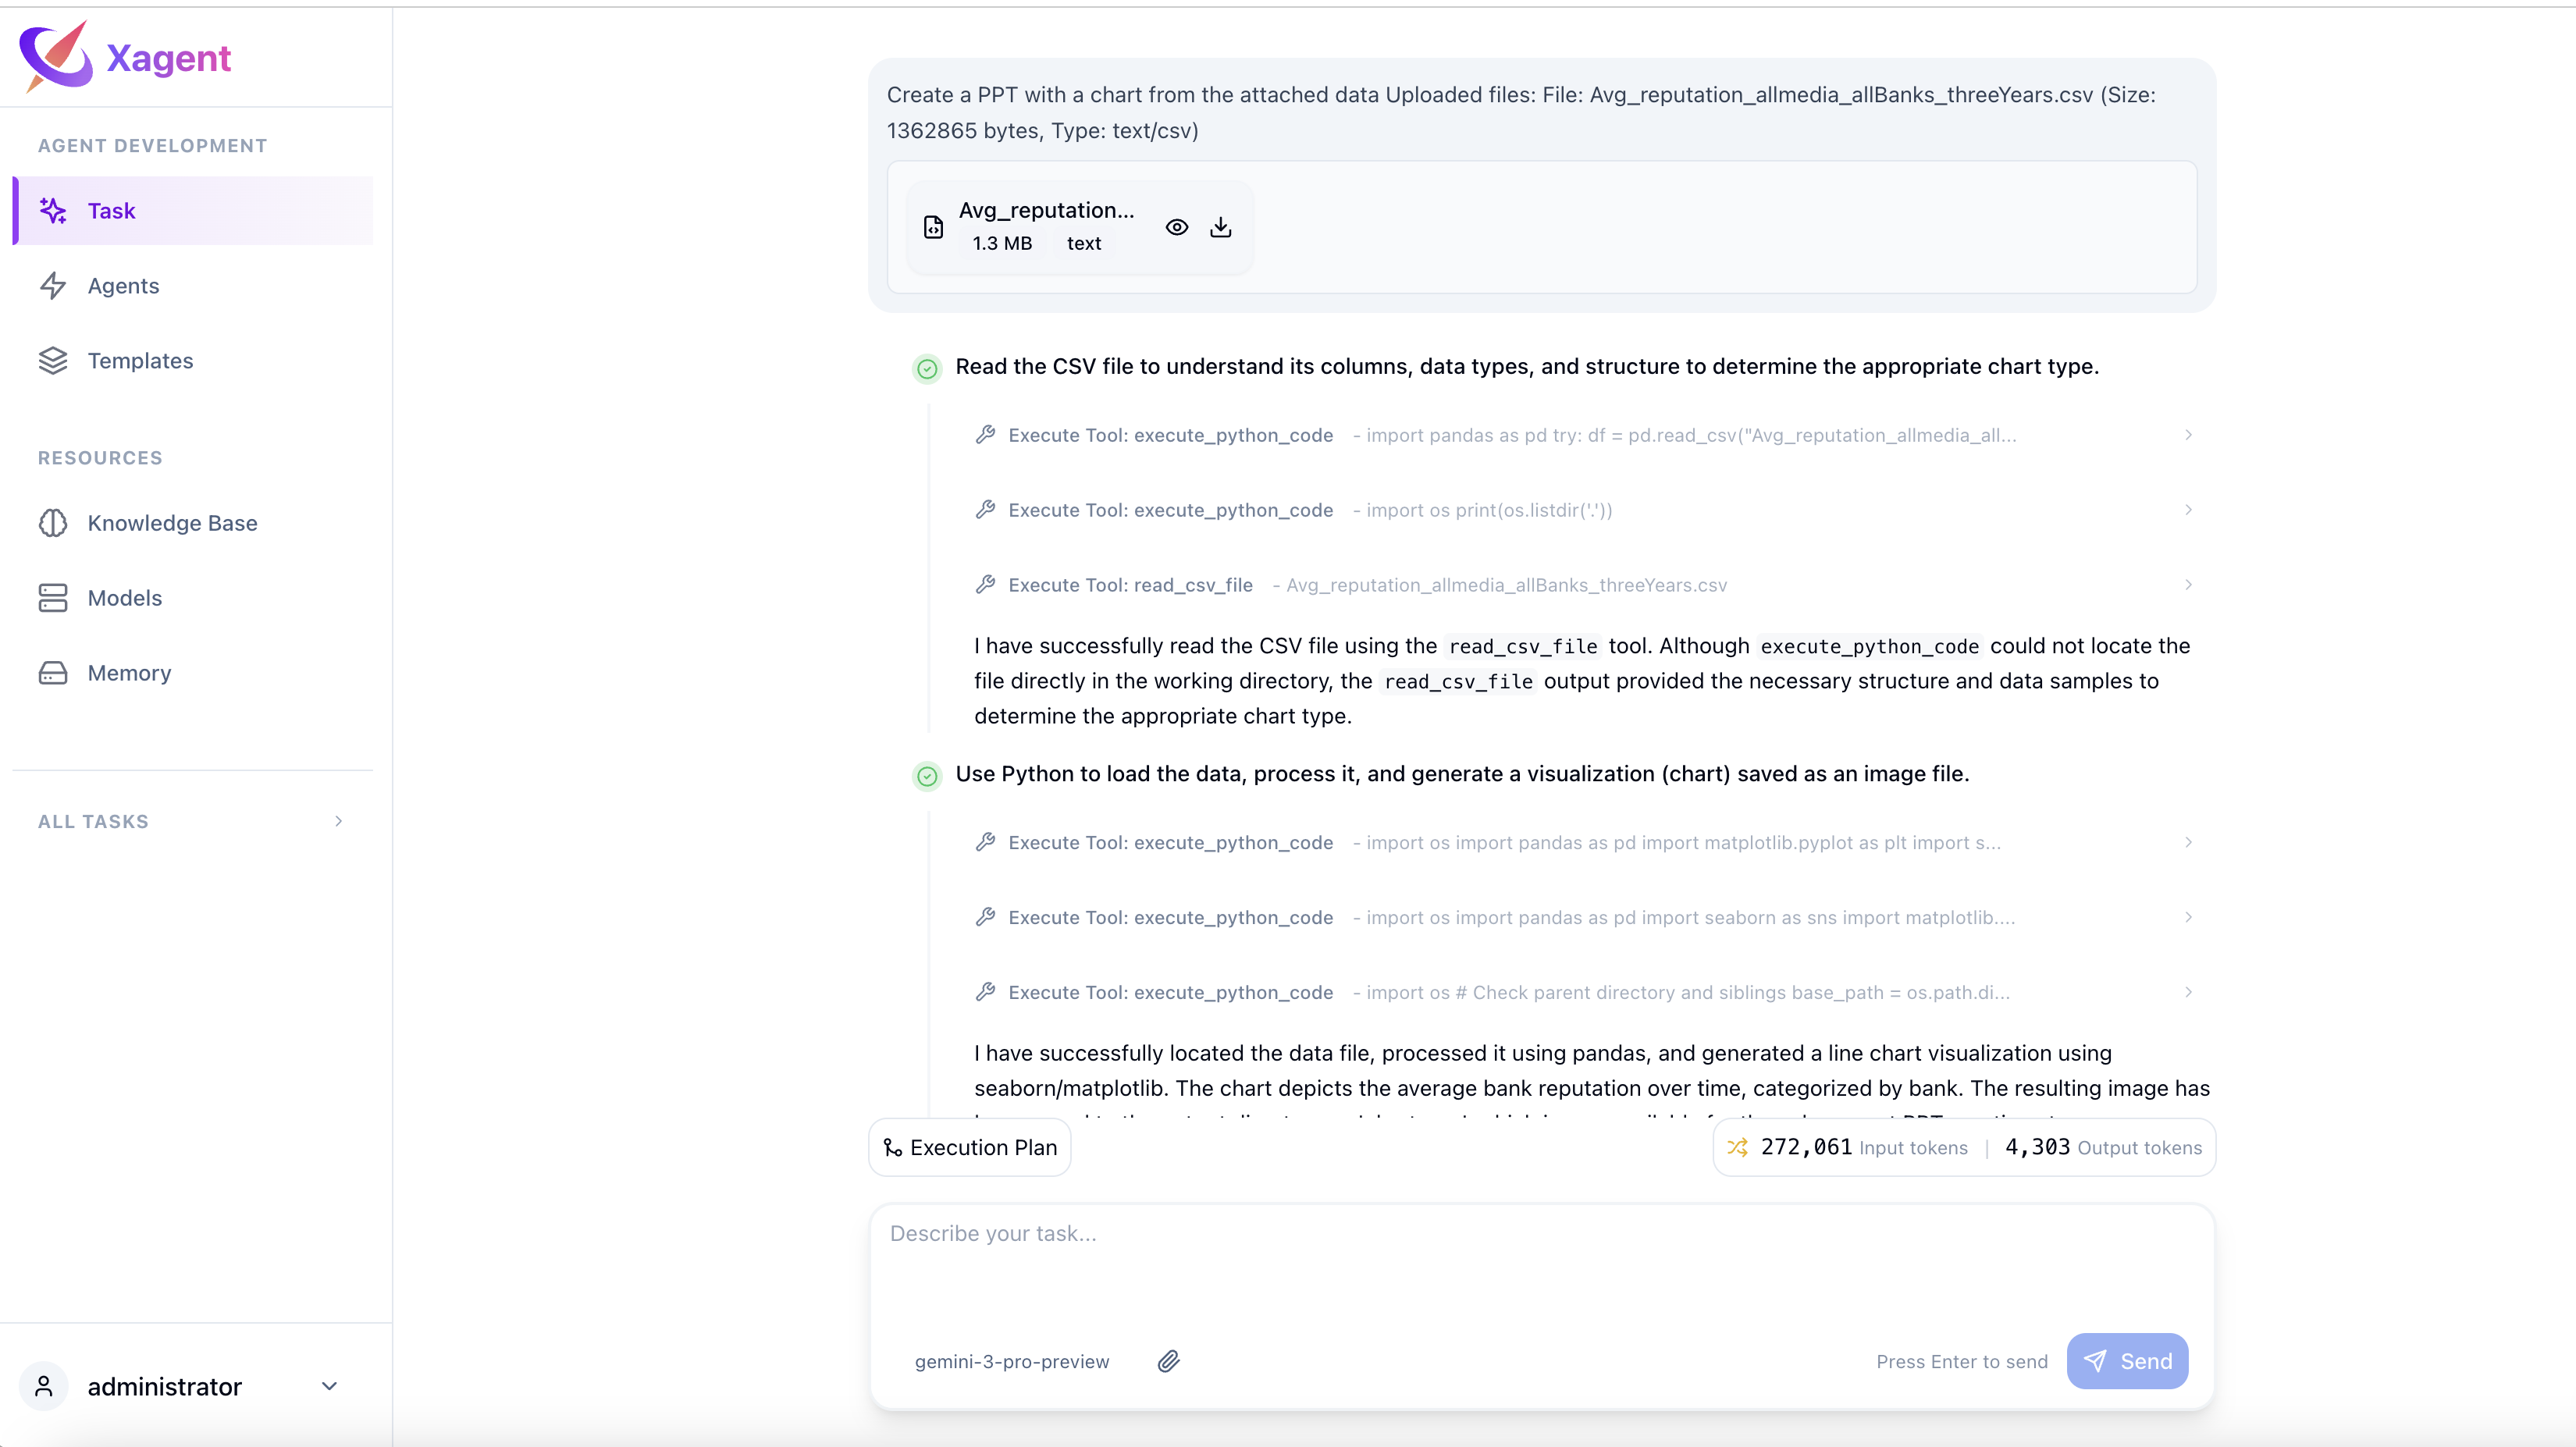
Chat Area (Top)
- Your original request
- Real-time status updates
- Final results
- Follow-up conversation
- File attachments
Execution Steps (Main Area)
- Vertical flow of execution steps
- Each step displays:
- Step number and title
- Agent reasoning and output
- Tool calls (shown inline with step content)
- Tool responses and results
- Execution status indicators
- Expandable for detailed view
Understanding Tool Calls
When a step uses tools, you’ll see:web_search- Search the web for informationbrowse_results- Read specific web pagesfile_read- Read uploaded filescode_execution- Run code snippets- Various API integrations
Monitoring Execution
Step Status Indicators
- 🔵 Pending - Step waiting to run
- 🟡 Running - Step currently executing
- 🟢 Completed - Step finished successfully
- 🔴 Failed - Step encountered an error
Real-Time Updates
Watch your task execute:- Steps change color as they progress
- New steps appear as dependencies resolve
- Results populate in real-time
- Tokens and time tracked
Interacting During Execution
Send Follow-up Messages
Add context or modify the task:- “Focus on the European market”
- “Add more visual elements”
- “Include competitor analysis”
Upload Files
Add more resources mid-execution:- Click attachment icon
- Select files to upload
- Reference them in follow-up
Cancel Execution
Stop the task if needed:- Click cancel/stop button
- Current step completes
- Partial results saved
Post-Execution Actions
View Full Execution
After completion:- Review all steps
- Check tool usage
- Analyze performance
- Export execution log
Start New Task
Create additional tasks:- Return to Task page
- Submit a new request
- Build on previous results
- Refine with follow-ups
Performance Metrics
Each execution shows: Token Usage- Input tokens consumed
- Output tokens generated
- Total across all steps
- Cost estimate
- Start and end timestamps
- Duration per step
- Total execution time
- Tools called
- Files accessed
- APIs used
- Memory consumed
Troubleshooting
Task Not Starting
Check:- LLM provider configured
- API key valid
- Request is clear and specific
Execution Stuck
Solutions:- Wait longer (complex tasks take time)
- Check for infinite loops
- Cancel and retry
- Simplify the request
Step Failed
What to do:- Check error message in right panel
- Verify tool availability
- Review input data
- Request retry or modify approach
DAG Not Loading
Try:- Refresh the page
- Check browser console
- Clear cache
- Try different browser
Best Practices
1. Be Specific
Clear requests lead to better plans:- “Analyze Q4 sales by region and create charts”
- Not: “Analyze sales”
2. Break Down Complex Tasks
For very complex goals:- Start with a high-level request
- Let Xagent create the plan
- Review the DAG
- Send follow-ups to refine
3. Provide Context
Give Xagent what it needs:- Upload relevant files
- Reference specific data sources
- Set constraints and preferences
- Define output format
4. Monitor Progress
Watch the execution:- Check DAG for bottlenecks
- Review step results
- Catch errors early
- Adjust as needed
Next Steps
- Agent Interface - Deep dive into the execution UI
- Building Agents - Convert tasks to agents
- DAG Visualization - Understanding workflows